
Casey's Print Arrives With the Analyst-Price Gap Still Wide
Produced automatically from ORTEX data and published under the ORTEX News editorial standards set by Peter Hillerberg, Editor, ORTEX News. How we publish
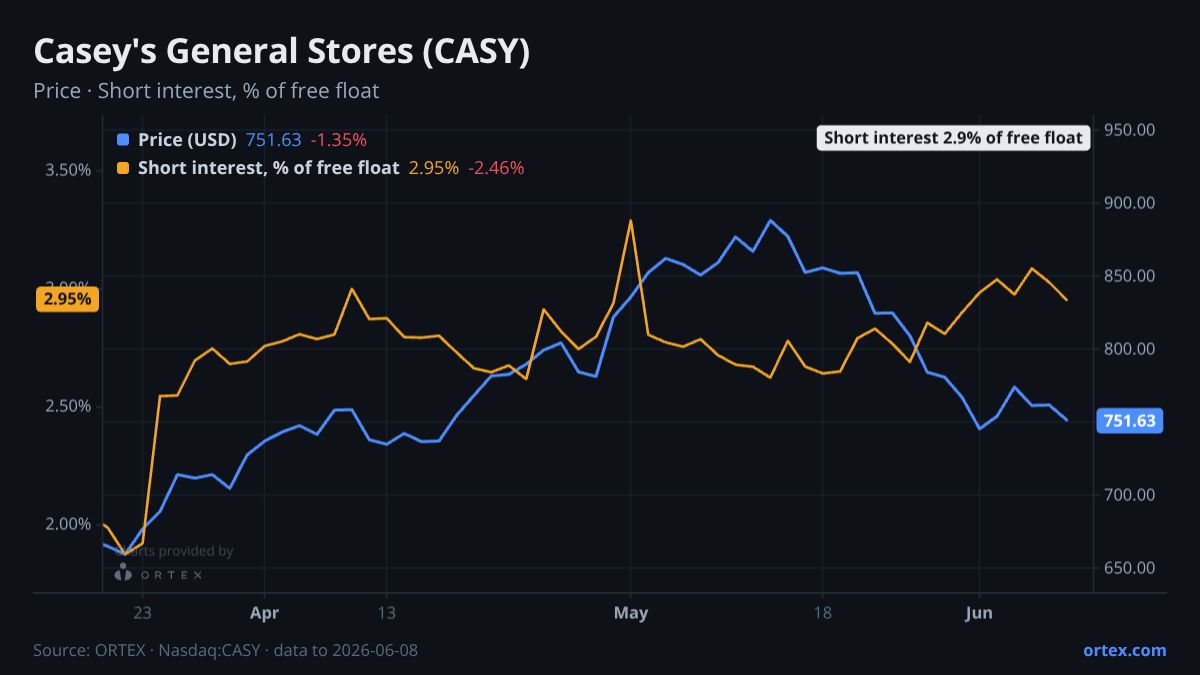
Casey's General Stores heads into its June 10 earnings release with the stock up marginally on the week but still nursing an 11% monthly loss — and the Street's price targets sitting well above where shares are trading.
The analyst-versus-price divergence that defined the two most recent previews on this name has not closed. The consensus mean target is $839, roughly 10% above Tuesday's close of $761.18. The majority of recent target moves have been upward: Wells Fargo is at $910 with Overweight, Keybanc at $860 with Overweight, and William Blair initiated coverage with Outperform in May. The sideline camp — UBS at $805 Neutral, JP Morgan at $719 Neutral — remains focused on valuation. The PE multiple has compressed nearly 6 points over the past month to around 35x, which partially answers the bears, but EV/EBITDA near 18.5x still leaves limited room for disappointment. That tension — upward revisions colliding with a stock that kept falling — is what today's print will attempt to resolve.
The bull case rests on Casey's rural Midwest footprint, where roughly half of stores operate in lower-competition geographies, and on the prepared foods segment's role as a consistent traffic driver. Bears point to decelerating sales growth, rising operating expenses, and a valuation that prices in execution before it is delivered. Factor scores add modest support to the constructive side: EPS momentum ranks in the 88th percentile over 90 days, and the analyst recommendation differential scores in the 90th percentile — both reflecting the recent wave of upward revisions.
Positioning itself is notably calm. Options traders are not hedging aggressively: the put/call ratio at 1.19 is almost exactly in line with its 20-day average, with a z-score near zero. Short interest at roughly 3% of the free float is low and has edged down from its monthly peak. Borrow availability is deep — over 2,700% of short interest — meaning there is no meaningful squeeze dynamic in the lending market. Cost to borrow has ticked up about 12% over the week to 0.46%, but at that absolute level it remains trivial. The lending picture has not changed materially since the June 8 preview: the market is loose, and bears are not pressing aggressively into the print.
The earnings report is therefore less about confirming whether Casey's model is working and more about whether the fuel margin trajectory and prepared foods comps can justify the gap between the stock and a Street that has spent the past two months raising its view.
Against its own history
This week's change in short interest is 2.7 standard deviations above the company's typical weekly move over the past year. Short interest is at its highest level in at least a year.
Against its peers
Shares moved +0.9% over the past week against a median of +1.6% for its closest peers.
Stocks in this article
See the live data behind this article on ORTEX.
Open CASY on ORTEX →How this article was generated
- Generated
- 10 Jun 2026, 04:03
- Data as of
- 10 Jun 2026, 04:01
- Prompt version
- v1.0
- Data sources
- Short interestCost to borrowUtilizationOptions flowEarningsAnalyst consensusInstitutional positioningORTEX Alpha signalsRecent ORTEX notesPrevious Mi Articles
ORTEX Market Intelligence content is generated by AI from a snapshot of ORTEX's proprietary data and reviewed by the ORTEX team. Content is informational only and does not constitute investment advice.