
MERLIN Bucks the Peer Tide as Analysts See More Room to Run
Produced automatically from ORTEX data and published under the ORTEX News editorial standards set by Peter Hillerberg, Editor, ORTEX News. How we publish
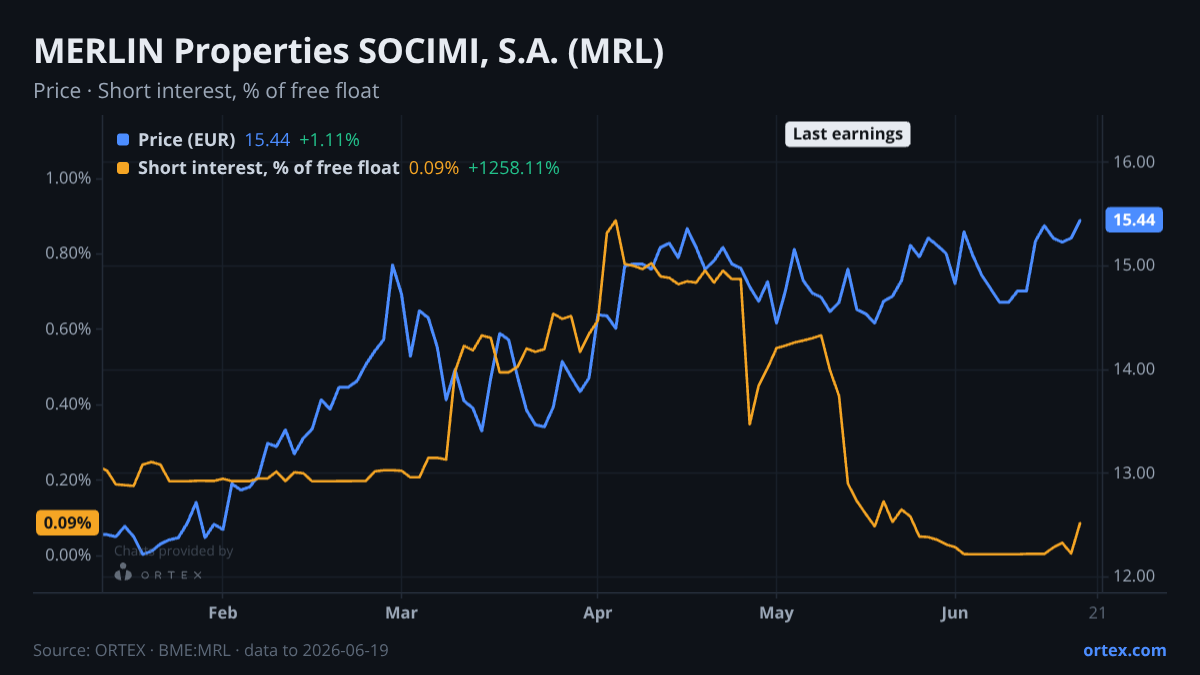
MRL is moving in the opposite direction to nearly every correlated peer this week — a quiet but notable divergence for a stock now trading within touching distance of its 52-week high.
The price story is straightforward. MRL closed at €15.44 on June 19, up 1.1% on the day and 1.3% on the week. That is a clean contrast with the peer group: SHC fell 1.1% on the week, BLND dropped 4.2%, LAND shed 5.6%, and COV lost 3.5%. Against that backdrop, MERLIN's month-to-date gain of 6.9% looks like genuine relative strength rather than sector drift. The stock is running near its 52-week high, which puts it in the top handful of European real estate names on price momentum.
The borrow market offers no friction here — this is an almost entirely unleveraged-short story. Availability is effectively unlimited, with the lending pool holding far more shares than any short position could meaningfully absorb. The ORTEX short score of 25.1 ranks in the 99th percentile for lack of short pressure — meaning virtually no peers have a less crowded short book. Cost to borrow has edged up about 10% over the past week to 0.76%, but that number is so low in absolute terms that it implies no real cost for anyone wanting to maintain a hedge. Days-to-cover ranks in the 95th percentile, another signal that short sellers are not a factor here. Positioning, in short, is one-sided toward the long: the stock is being accumulated, not fought.
The Street remains constructive, with a consensus mean price target of €17.38 as of June 11 — roughly 12.5% above the current price. The analyst recommendation differential ranks in the 94th percentile, placing MERLIN among the most positively skewed names in its universe. Valuation multiples reflect a stock that has been re-rated upward: price-to-book has climbed to 0.94, up from around 0.90 a month ago and now approaching par with net asset value. The P/E of 27.6x and EV/EBITDA of 28.1x are not cheap in absolute terms, but both have eased modestly over the past month, suggesting the re-rating has been driven by earnings upgrades rather than pure multiple expansion. EPS momentum over 30 days ranks at 69, the strongest of the near-term growth signals — a marked improvement from the weakness flagged in earlier score histories.
The institutional register adds a layer of stability. Santander Asset Management holds 22.5% of shares, providing a structural floor. BlackRock added 125,000 shares through the end of May, and Goldman Sachs Group lifted its position by nearly 4.7 million shares through early May — a material move for a name of this size. Insider activity has been mixed but modest: one group director has been selling in small tranches since April, while another bought in mid-May, and the 90-day net position is positive at around 160,000 shares. None of this is large enough to be definitive, but the Goldman accumulation stands out as the most meaningful directional signal from a major institution.
Earnings are the next scheduled event, with MERLIN's results due July 30. The two most recent prints produced minimal same-day moves — a 0.5% slip and a 2.8% gain — suggesting the market has generally treated these releases as confirmation rather than surprise. What the next print will test is whether the 30-day EPS momentum score continues to hold at its current elevated level, and whether the narrowing gap between price and the analyst consensus target prompts further target upgrades from the Street.
Against its own history
This week's change in short interest is 24.1 standard deviations above the company's typical weekly move over the past year.
Against its peers
Shares moved +1.3% over the past week against a median of -3.1% for its closest peers.
Stocks in this article
See the live data behind this article on ORTEX.
Open MRL on ORTEX →How this article was generated
- Generated
- 20 Jun 2026, 17:31
- Data as of
- 20 Jun 2026, 17:30
- Prompt version
- v1.0
- Data sources
- Cost to borrowUtilizationEarningsAnalyst consensusInstitutional positioningORTEX Alpha signalsRecent ORTEX notes
- Validation notes
- soft: missing section mentions: short interest (informational only)
ORTEX Market Intelligence content is generated by AI from a snapshot of ORTEX's proprietary data and reviewed by the ORTEX team. Content is informational only and does not constitute investment advice.