
GEV puts jump as $908 stock nears earnings
Produced automatically from ORTEX data and published under the ORTEX News editorial standards set by Peter Hillerberg, Editor, ORTEX News. How we publish
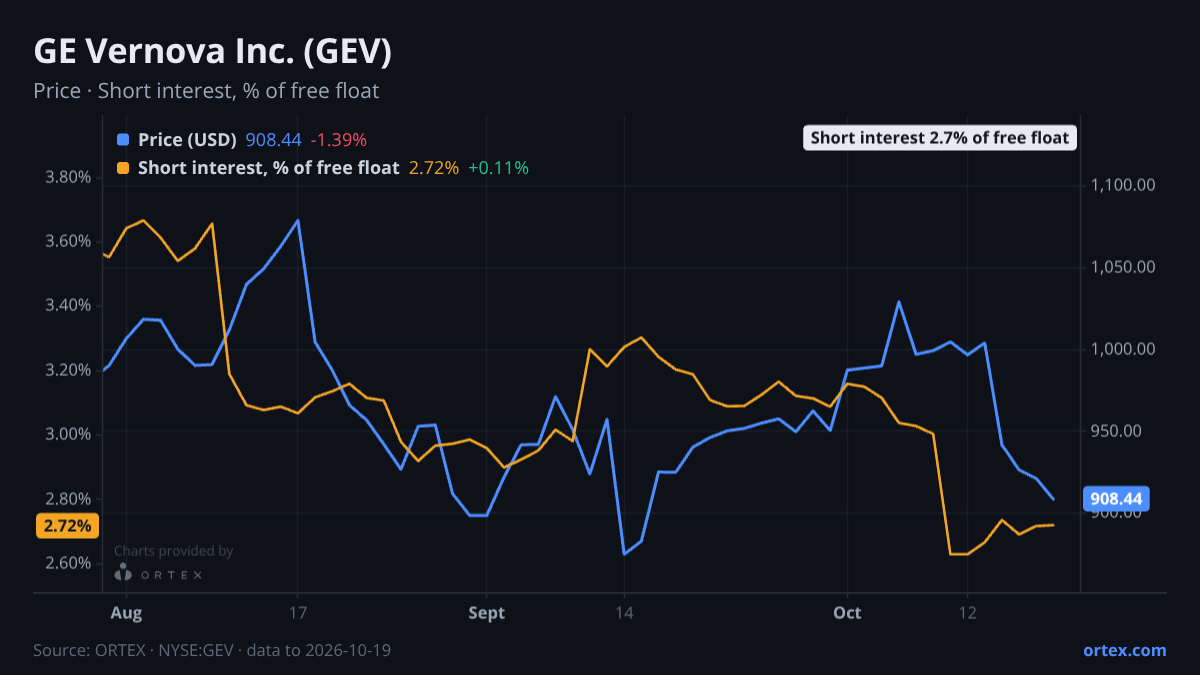
GE Vernova's put-call ratio hit 1.46 on October 19, 2.3 standard deviations above its 20-day mean. The stock has dropped 8.9% over the past week to $908, a move almost exactly in line with the median for its closest peers, which fell 8.8% on average over the same period.
Options market turns defensive
The PCR of 1.46 is now approaching its 52-week high of 1.50. For most of the past month the ratio had been ranging between 1.36 and 1.42. The single-day jump on October 19 stands out against that backdrop. With earnings due October 28, the options market is pricing in more downside protection than it has for most of the past year. The last comparable PCR peak, at 1.46 in late September, coincided briefly with a period when the stock was also off its highs.
The cost to borrow rose 57.9% over the week to 0.38%. In absolute terms that is still a low rate. The lending market remains extremely loose: availability stands at 3,882%, meaning roughly 39 shares are available to borrow for every one already lent out. Short interest is 2.7% of free float, down about 15% over the past month as some shorts have covered.
What the Street says
Analysts are broadly constructive but have been marking down targets. JP Morgan cut to $1,150 from $1,330 on October 9. Susquehanna trimmed to $1,270 from $1,300 on October 14. Both kept their positive ratings. Guggenheim stood firm at $1,450 Buy. The consensus remains Buy across 25 firms. Targets across the recent changes span $470 (GLJ Research, Sell, initiated in September) to $1,450, a gap that reflects genuinely different views on whether the power and electrification demand cycle has already peaked in the order book.
The bear case centres on turbine contract additions slowing to 20GW in the most recent quarter, down from 24GW earlier in the year, with second-half implied additions running below prior targets. Wind remains a drag, with EBITDA losses and revenue down year on year. The bull case rests on visible backlog, pricing power in gas turbines and grid equipment, and a datacenter demand tailwind that management has called a structural growth driver.
Peer context
Peers sold off sharply alongside GEV this week. VRT fell 13.9%, NVT dropped 13.0%, and ETN lost 8.2%. The sector move was broad. GEV's 8.9% decline is neither an outlier to the downside nor a sign of relative strength: it tracked the group almost precisely.
The one thing that separates GEV from the peer group right now is the October 28 earnings date, eight days away. The PCR close to a 52-week high, combined with two target cuts in the past two weeks, makes the options positioning the cleanest signal of where uncertainty is concentrated. Watch whether the PCR stays above its 20-day mean into the print or pulls back as traders close hedges ahead of the event.
Data summary
- Price: $908.44, down 8.9% on the week
- Put-call ratio: 1.46 (52-week high: 1.50; 20-day mean: 1.40; z-score: 2.3)
- SI % of free float: 2.7%, down 15% over one month
- Availability: 3,882% (very loose)
- Cost to borrow: 0.38%, up 57.9% on the week
- Earnings: October 28
Against its peers
Shares moved -8.9% over the past week against a median of -8.8% for its closest peers.
Stocks in this article
See the live data behind this article on ORTEX.
Open GEV on ORTEX →How this article was generated
- Generated
- 20 Oct 2026, 12:56
- Data as of
- 20 Oct 2026, 12:46
- Prompt version
- v1.0
- Data sources
- Short interestCost to borrowUtilizationOptions flowEarningsAnalyst consensusInstitutional positioningORTEX Alpha signalsRecent ORTEX notesAlt DataPrevious Mi Articles
ORTEX Market Intelligence content is generated by AI from a snapshot of ORTEX's proprietary data and reviewed by the ORTEX team. Content is informational only and does not constitute investment advice.