
Newmont Slips After Earnings Miss, but Shorts Stay Modest
Produced automatically from ORTEX data and published under the ORTEX News editorial standards set by Peter Hillerberg, Editor, ORTEX News. How we publish
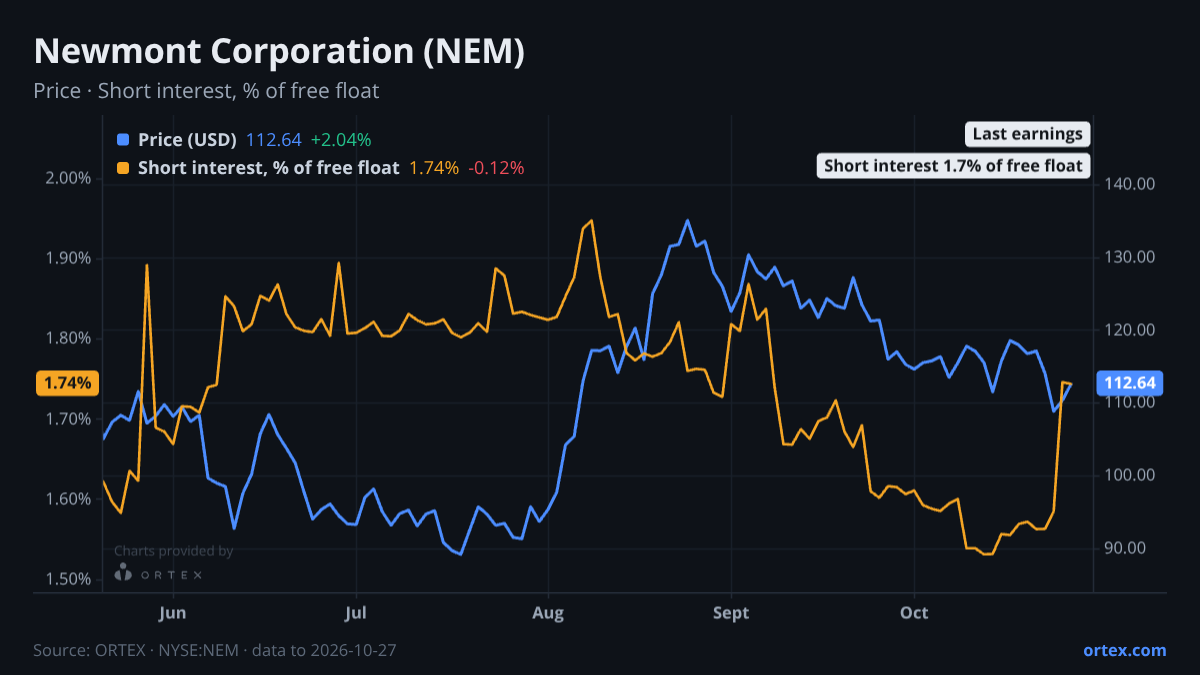
Newmont Corporation, the world's largest gold miner, fell 7.1% when it reported Q3 results on October 22 and has shed another 3.6% over the past week to trade at $112.64, putting the stock 7.2% lower on the month. The decline tracks closely with the broader gold sector: AEM is down 3.0% on the week, AU off 4.5%, and WPM down 4.2% over the same period, so the pressure reads as sector-wide rather than company-specific.
Short interest picked up meaningfully after the print, though it remains too small to be the defining story. Shares short climbed roughly 11% over the past week to 18.1 million, representing 1.66% of free float, the sharpest weekly build since September and an unusual move: ORTEX context notes this week's change sits 2.1 standard deviations above the typical weekly swing over the past year. The build is notable for its timing rather than its size. Even at 18.1 million shares, NEM's short position is low in absolute terms, and the borrow market offers no resistance to anyone wanting to add: nearly one billion shares remain available to lend, cost to borrow is 0.52%, and nothing in the lending data points to squeeze pressure. The options market is similarly calm. The put/call ratio of 0.78 is fractionally above its 20-day average of 0.77 and well below the 52-week high of 0.88, suggesting no unusual demand for downside protection in derivatives.
Analyst reactions to the earnings miss have been mixed rather than uniformly negative. Scotiabank trimmed its target by $1 to $148 on October 27 while keeping its Sector Outperform. Freedom Broker moved the most aggressively, cutting from Buy to Hold and slashing its target from $130 to $116 on October 22, the day of the print. That downgrade sits against a still-constructive broader picture: Citigroup raised its target from $125 to $140 just two days before the results, Barclays holds an Overweight at $123, and RBC Capital maintains a $155 Outperform. The Street mean target is $135.65, implying roughly 20% upside from current levels. Valuation multiples remain undemanding for the sector: P/E of 11.4x and EV/EBITDA of 6.4x, with the EV/EBIT factor ranking in the 81st percentile of Newmont's universe. The dividend factor score ranks in the 94th percentile, reflecting the company's income credentials. Forward earnings momentum is the weak spot: the 30-day EPS momentum factor sits in the 36th percentile, and the 90-day reading is at the 42nd, consistent with a market that has trimmed near-term expectations after the Q3 shortfall.
The insider register adds a layer of context. Recent Form 4 filings show CEO Natascha Viljoen sold shares on October 1 and September 1, both under pre-arranged 10b5-1 plans, as did EVP Peter Toth on the same dates. CFO Brian Tabolt sold 11,445 shares at $105.09 on August 5 outside a 10b5-1 plan, a discretionary sale worth roughly $1.2 million. Net across the 90 days to October 1, insiders sold a net $3.9 million of stock. The CEO and CFO sales occurred above the current price, though the 10b5-1 structure for most of the trades limits how much signal to extract from the timing.
Two alt-data points from SEC filings add colour on the capital allocation picture. Newmont's buyback spend in Q2 2026 came to $1.57 billion, up 55% on the same quarter a year earlier and the largest second quarter for buyback spend in the dataset going back to 2018. Monthly buyback data through September confirms activity has continued into the second half of the year. Whether Q3 buyback activity held at a similar pace is a question the next filing cycle will answer; the next earnings event is scheduled for February 18, 2027.
The stock has recovered 2.0% on the day as of October 27. With the Q3 result now in the market, the conversation shifts to whether gold prices above $4,000 per ounce translate into better cost absorption in the quarters ahead, and whether the pace of buyback spending disclosed in the next quarterly filing confirms that capital return remained a priority through the recent pullback.
Against its own history
This week's change in short interest is 2.1 standard deviations above the company's typical weekly move over the past year.
Against its peers
Shares moved -3.6% over the past week against a median of -3.5% for its closest peers.
Stocks in this article
See the live data behind this article on ORTEX.
Open NEM on ORTEX →How this article was generated
- Generated
- 28 Oct 2026, 18:40
- Data as of
- 28 Oct 2026, 18:40
- Prompt version
- v1.0
- Data sources
- Short interestCost to borrowUtilizationOptions flowEarningsAnalyst consensusInstitutional positioningORTEX Alpha signalsRecent ORTEX notesAlt DataPrevious Mi Articles
ORTEX Market Intelligence content is generated by AI from a snapshot of ORTEX's proprietary data and reviewed by the ORTEX team. Content is informational only and does not constitute investment advice.