
Nvidia short sellers beat GameStop: $14.7bn in two weeks, the most on any US stock in 10 years
Produced automatically from ORTEX data and published under the ORTEX News editorial standards set by Peter Hillerberg, Editor, ORTEX News. Reviewed by Peter Hillerberg before publication. How we publish
Reviewed by Peter Hillerberg,
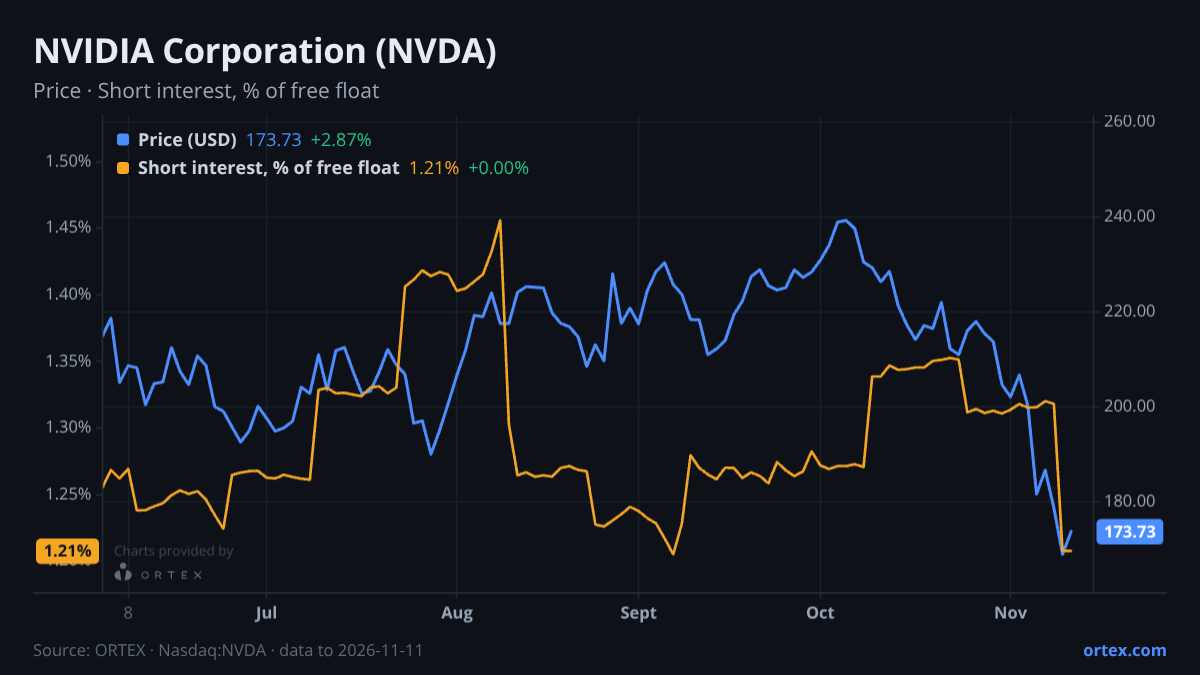
Short sellers in Nvidia (NVDA) have just had the most profitable two weeks on any US stock in at least 10 years.
In the 10 trading days to Monday, November 10, ORTEX estimates that short sellers made $14.7bn as Nvidia fell from $217.94 to $168.89. That beats the previous record, the GameStop (GME) collapse of early 2021, when short sellers made $13.3bn in 10 trading days as the stock fell from $347.51 to $51.20 (prices before GameStop's 2022 stock split).
From the world's most valuable company to number two
On October 28 Nvidia was the world's most valuable company, worth $5.2 trillion. The first reports about chief executive Jensen Huang came on October 29, followed by a board probe and a second report after the close on Wednesday, November 11.
Since then Nvidia has lost more than $1 trillion in market value. Apple (AAPL) passed it on October 30, Nvidia took the top spot back for one day on November 3, and Apple has led since November 4. Microsoft (MSFT) is now close behind Nvidia in third place.
What Nvidia short sellers have made
| Period | Nvidia share price | Short sellers' estimated gain |
|---|---|---|
| October 29 to November 11 close | $215.38 to $173.73 | $12.6bn |
| Best day: November 5, the wider AI sell-off | down 9.3% | $5.7bn |
| Best 10 trading days: October 28 to November 10 | $217.94 to $168.89 | $14.7bn |
| Best 21 trading days: October 13 to November 10 | $226.32 to $168.89 | $17.4bn |
Nvidia fell about another 6% in pre-market trading on Thursday, November 12. At that level short sellers' gain since October 29 rises to about $15.5bn.
The record: best 10 trading days for short sellers, any US stock
| Rank | Stock | 10 trading days | Share price | Short sellers' estimated gain |
|---|---|---|---|---|
| 1 | Nvidia (NVDA) | Oct 28 to Nov 10, 2026 | $217.94 to $168.89 | $14.7bn |
| 2 | GameStop (GME) | Jan 28 to Feb 10, 2021 | $347.51 to $51.20 | $13.3bn |
| 3 | Micron (MU) | Jun 23 to Jul 7, 2026 | $1,211.38 to $938.38 | $10.7bn |
| 4 | Tesla (TSLA) | Feb 22 to Mar 5, 2021 | $781.30 to $597.95 | $9.1bn |
| 5 | Tesla (TSLA) | Dec 18, 2024 to Jan 2, 2025 | $479.86 to $379.28 | $8.1bn |
| 6 | Nvidia (NVDA) | Feb 21 to Mar 6, 2025 | $140.11 to $110.57 | $7.4bn |
Nvidia also holds the record over a month: $17.4bn in 21 trading days, ahead of Micron's $15.6bn in July 2026.
Over shorter periods GameStop still leads. Its short sellers made $11.7bn in five trading days in early 2021, just ahead of Nvidia's best week of $11.3bn, and $7.5bn on January 28, 2021 alone. Nvidia's best single day for short sellers remains the DeepSeek sell-off of January 27, 2025, at $6.7bn.
A small short position at a huge size
Only about 1.2% of Nvidia's free float is sold short, 280 million shares on November 10. That is low for Nvidia: it has ranged between 1.0% and 1.5% this year. But at Nvidia's size even 1.2% is worth about $49bn of stock at Wednesday's close, which is why a fall of nearly a quarter in the share price turns into a record for the people on the other side.
Did short sellers see it coming?
There is no sign of it in the short interest data. Shares sold short fell from 313 million on October 23 to 304 million on October 26, before the first report, and stayed between 304 million and 306 million until November 9. On Tuesday, November 10, short sellers bought back about 26 million shares and took profits.
Much of Nvidia's short interest is also likely to be hedging by index, ETF and options market makers rather than outright bets against the company.
How ORTEX measures this
ORTEX estimates short sellers' daily profit or loss as the number of shares sold short multiplied by the move in the share price that day, using ORTEX's daily short interest estimates and the prices stocks actually traded at, before any later stock split. The ranking covers every US-listed stock with a short position large enough to make billions in a fortnight. ORTEX daily estimates are available from 2017, so "at least 10 years" is the full span of the comparison. Figures do not include options, borrowing costs or dividends.
Stocks in this article
See the live data behind this article on ORTEX.
Open NVDA on ORTEX →How this article was generated
- Generated
- 12 Nov 2026, 11:34
- Prompt version
- Data sources
- Short interestCost to borrowUtilizationAlt DataIndex Rebalance
ORTEX Market Intelligence content is generated by AI from a snapshot of ORTEX's proprietary data and reviewed by the ORTEX team. Content is informational only and does not constitute investment advice.